Three calculations the whole book rests on
Every figure below is taken from The Stat Man and recomputed here. Follow them with a calculator and you can already do the three things most bettors never do: read a price as a probability, see the margin, and build a number of your own to argue with it.
Convert a price into a probability
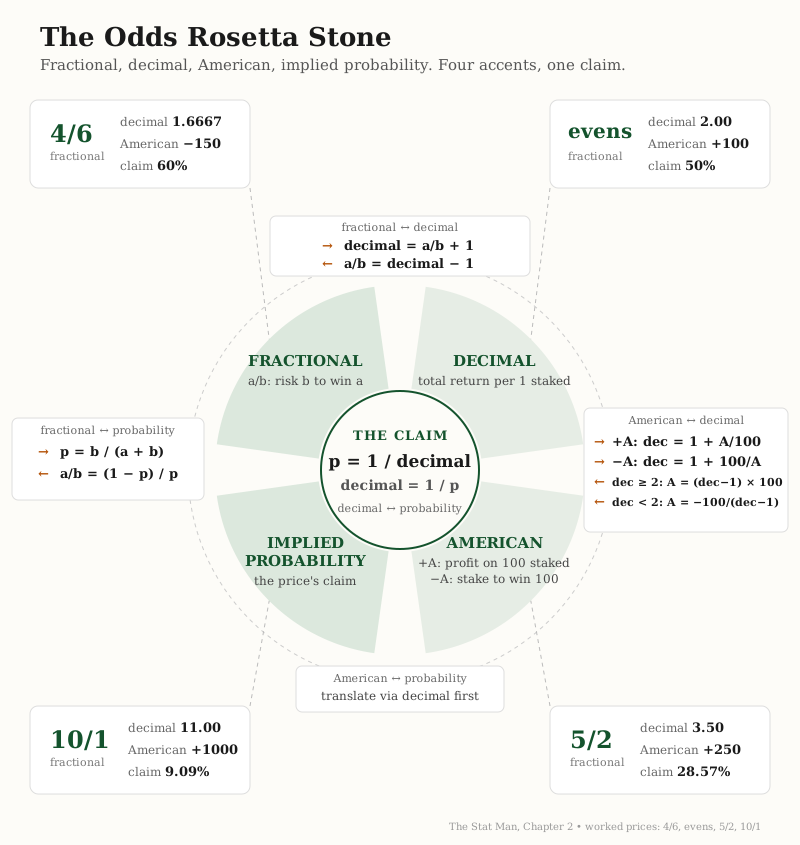
Every price is a claim about how often something happens. One division tells you what the claim is.
Read the price as a ratio
Fractional odds are written a/b, so 13/8 means you win 13 for every 8 staked. The two numbers are all you need.
Add both numbers together
13 plus 8 is 21. That total represents every unit at risk in the transaction, your stake included.
Divide the stake by the total
8 divided by 21 is 0.3810. Multiply by 100 and the price 13/8 is claiming a 38.10 per cent chance.
Compare it with your own number
If you believe the outcome happens more often than 38.10 per cent of the time, the price is generous. If less, it is short. That comparison, and nothing else, is what value means.
The answer
13/8 = 38.10 per cent
Strip the bookmaker's margin out
A book that sums above 100 per cent is charging rent on every outcome. Here is how to see it and remove it.
Convert every price to a probability
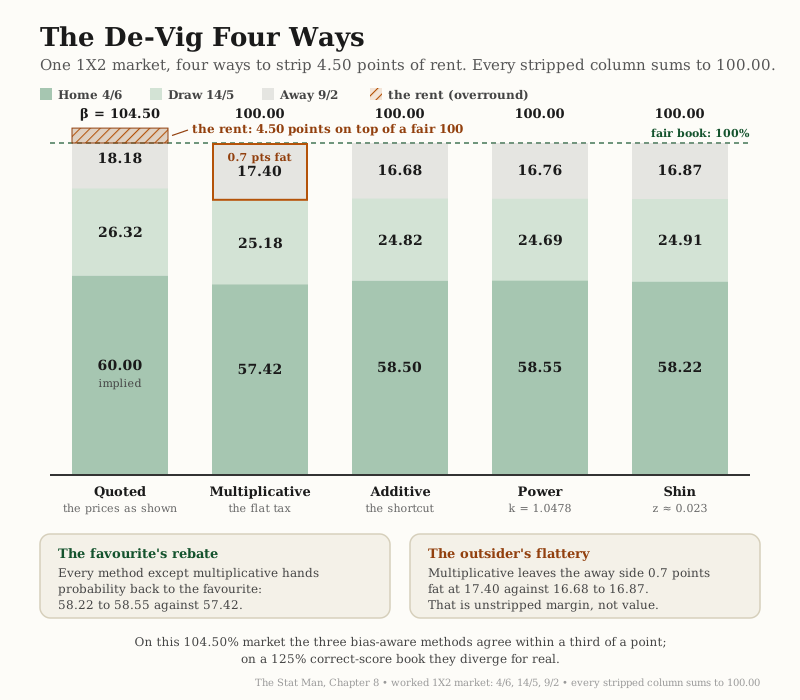
Take a three-way market priced 4/6, 14/5 and 9/2. Those convert to 60.00 per cent, 26.32 per cent and 18.18 per cent.
Add them up
60.00 plus 26.32 plus 18.18 is 104.50 per cent. A fair book sums to exactly 100, so this book carries 4.50 percentage points of margin.
Divide each probability by the total
60.00 divided by 1.0450 is 57.42 per cent. The other two become 25.18 per cent and 17.40 per cent, and the three now sum to 100.
Read the fair prices
Those margin-free probabilities are what the market actually believes. Anything you are offered above them is the house's head start, and it is charged on every outcome, not just the one you back.
The answer
Booksum 104.50 per cent, so 4.50 points of margin
Turn goal expectancies into a price
Two numbers, one distribution, and the whole match odds board falls out of the arithmetic.
Estimate each side's goal expectancy
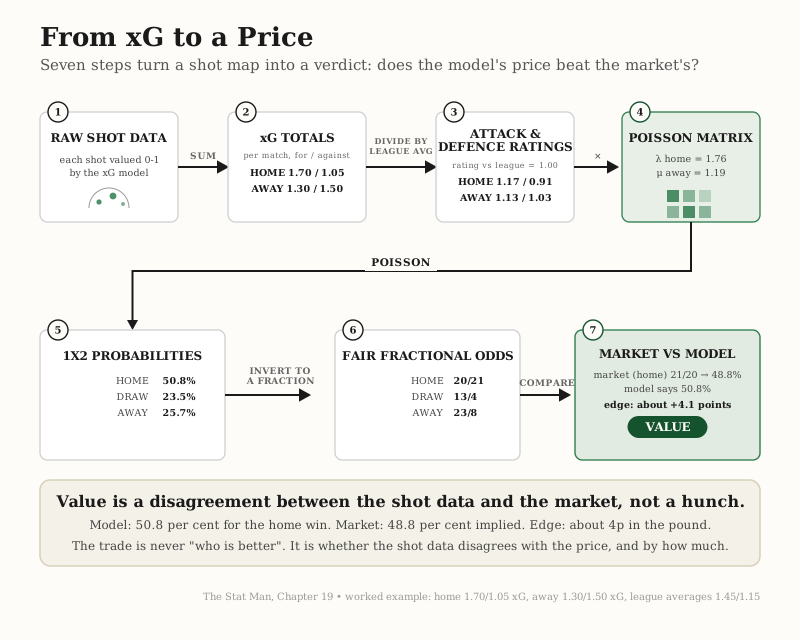
Start with the two numbers the whole model rests on: how many goals you expect each side to score. Take a home expectancy of 1.47 and an away expectancy of 0.93.
Apply the Poisson formula to each scoreline
For a given expectancy, the probability of exactly k goals is e to the power of minus the expectancy, multiplied by the expectancy to the power k, divided by k factorial. Run it for 0, 1, 2, 3 goals and beyond for both sides.
Multiply the two sides together for every scoreline
The probability of 1-0 is the chance the home side scores exactly one multiplied by the chance the away side scores none: 13.34 per cent. Do this for the whole grid of scorelines.
Add the cells into the three outcomes
Sum every cell where the home score is higher for the home win, every cell where they match for the draw, and the rest for the away win. Here that gives 49.7 per cent, 26.4 per cent and 23.9 per cent.
Convert to fair prices and compare
Those probabilities are fair decimal odds of 2.01, 3.79 and 4.19. Compare them with the market and you have a disagreement you can measure. The book then patches the model's known weaknesses, because raw Poisson underrates draws and low-scoring games.
The answer
49.7 / 26.4 / 23.9 per cent, or 2.01, 3.79 and 4.19
Questions
Questions about the modelling
Is Poisson good enough to price a football match on its own?
No, and the book is explicit about it. A plain Poisson model treats the two teams' goals as independent and underrates draws and low-scoring matches as a result. The Dixon-Coles correction adjusts exactly those low-scoring cells, and time decay weights recent matches more heavily. Poisson is the foundation, not the finished machine.
What margin do bookmakers usually build into a football market?
It varies by market and competition. A competitive three-way market on a major league might carry a few percentage points, while accumulator and bet-builder markets compound margin leg by leg: a four-leg accumulator at 8 per cent per leg works out at just over 26 per cent in aggregate before a ball is kicked.
Can I do this without programming?
The conversions and the margin arithmetic need nothing more than a calculator. Building and calibrating a full match model is more comfortable in a spreadsheet, and the book's appendices include a model-building checklist and a bet-tracking template for exactly that.
These three are the foundation. The book takes them through Dixon-Coles corrections, expected goals, team ratings, Monte Carlo simulation and fractional Kelly staking across 32 chapters.