Figure 16.1 · Chapter 16
The correct-score matrix
One Poisson distribution priced across the whole scoreline board.
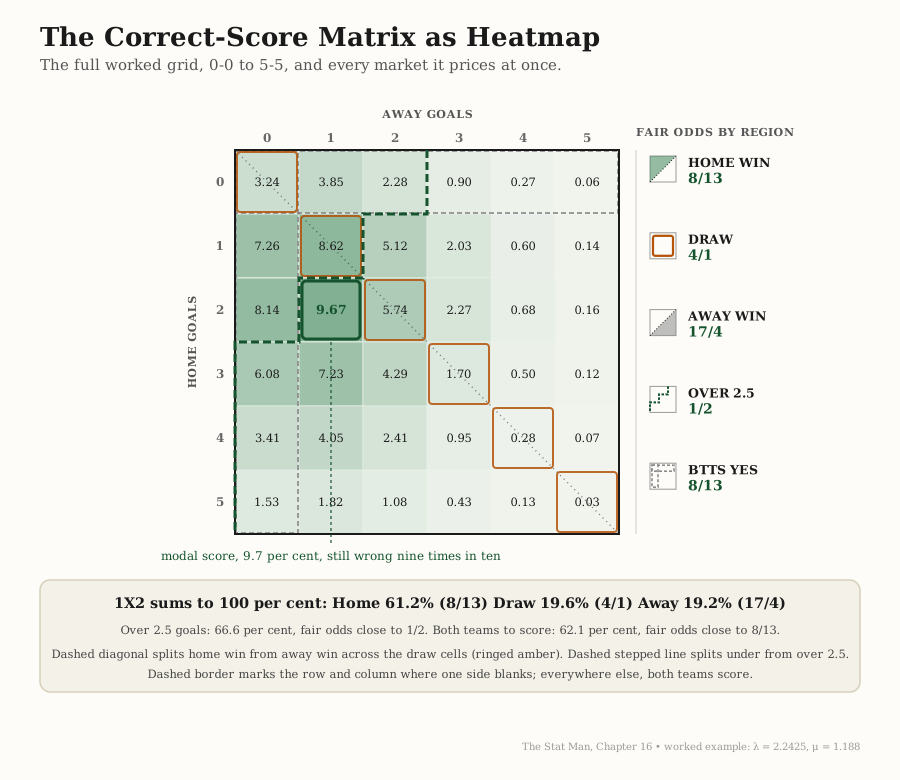
| Home goals | 0 | 1 | 2 | 3 | 4 | 5 |
|---|---|---|---|---|---|---|
| 0 | 3.24 | 3.85 | 2.28 | 0.90 | 0.27 | 0.06 |
| 1 | 7.26 | 8.62 | 5.12 | 2.03 | 0.60 | 0.14 |
| 2 | 8.14 | 9.67 | 5.74 | 2.27 | 0.68 | 0.16 |
| 3 | 6.08 | 7.23 | 4.29 | 1.70 | 0.50 | 0.12 |
| 4 | 3.41 | 4.05 | 2.41 | 0.95 | 0.28 | 0.07 |
| 5 | 1.53 | 1.82 | 1.08 | 0.43 | 0.13 | 0.03 |
Figure 16.1 from The Stat Man by Adrian Dane, Chapter 16. Free to quote with attribution.
This is reference lifted from the book. The chapters are where the arithmetic gets built and argued for.
Out now · free to read on Kindle Unlimited
Take the mask off the price
Start here
Kindle
Free to read with Kindle Unlimited
Reflowable · searchable · dark-mode friendly
ASIN B0GZ4X3L9R
Buy on Amazon
Paperback
The everyday reading copy
6 x 9 in · 571 pages
ISBN 9798189116001
Buy on Amazon
Hardback
Built to be a reference for years
Case laminate · 547 pages · lies flat on a desk
ISBN 9798189121197
Buy on Amazon